What is inventory turnover?
Inventory turnover measures how many times you sell and replace your inventory during a specific period, usually a year. A turnover ratio of 6 means you sold through your entire inventory six times in a year, or roughly every two months.
It is one of the most useful metrics for understanding whether you are carrying the right amount of stock. Too high and you risk stockouts. Too low and you have cash sitting on shelves collecting dust.
The inventory turnover formula

Inventory Turnover = Cost of Goods Sold / Average Inventory
Cost of goods sold (COGS) is the total cost of products you sold during the period. Pull this from your income statement.
Average inventory is the average value of inventory over the same period. Calculate it as: (Beginning Inventory + Ending Inventory) / 2.
Example: A sporting goods store had COGS of $240,000 for the year. Beginning inventory was $50,000 and ending inventory was $70,000. Average inventory is ($50,000 + $70,000) / 2 = $60,000. Inventory turnover = $240,000 / $60,000 = 4.0.
This store turns over its inventory four times per year, or about once every 91 days.
Days sales of inventory
A related and sometimes more intuitive metric is days sales of inventory (DSI), which tells you how many days it takes, on average, to sell your inventory.
DSI = 365 / Inventory Turnover
Using the example above: 365 / 4.0 = 91 days. It takes this store about three months to sell through its stock.
What good and bad ratios look like
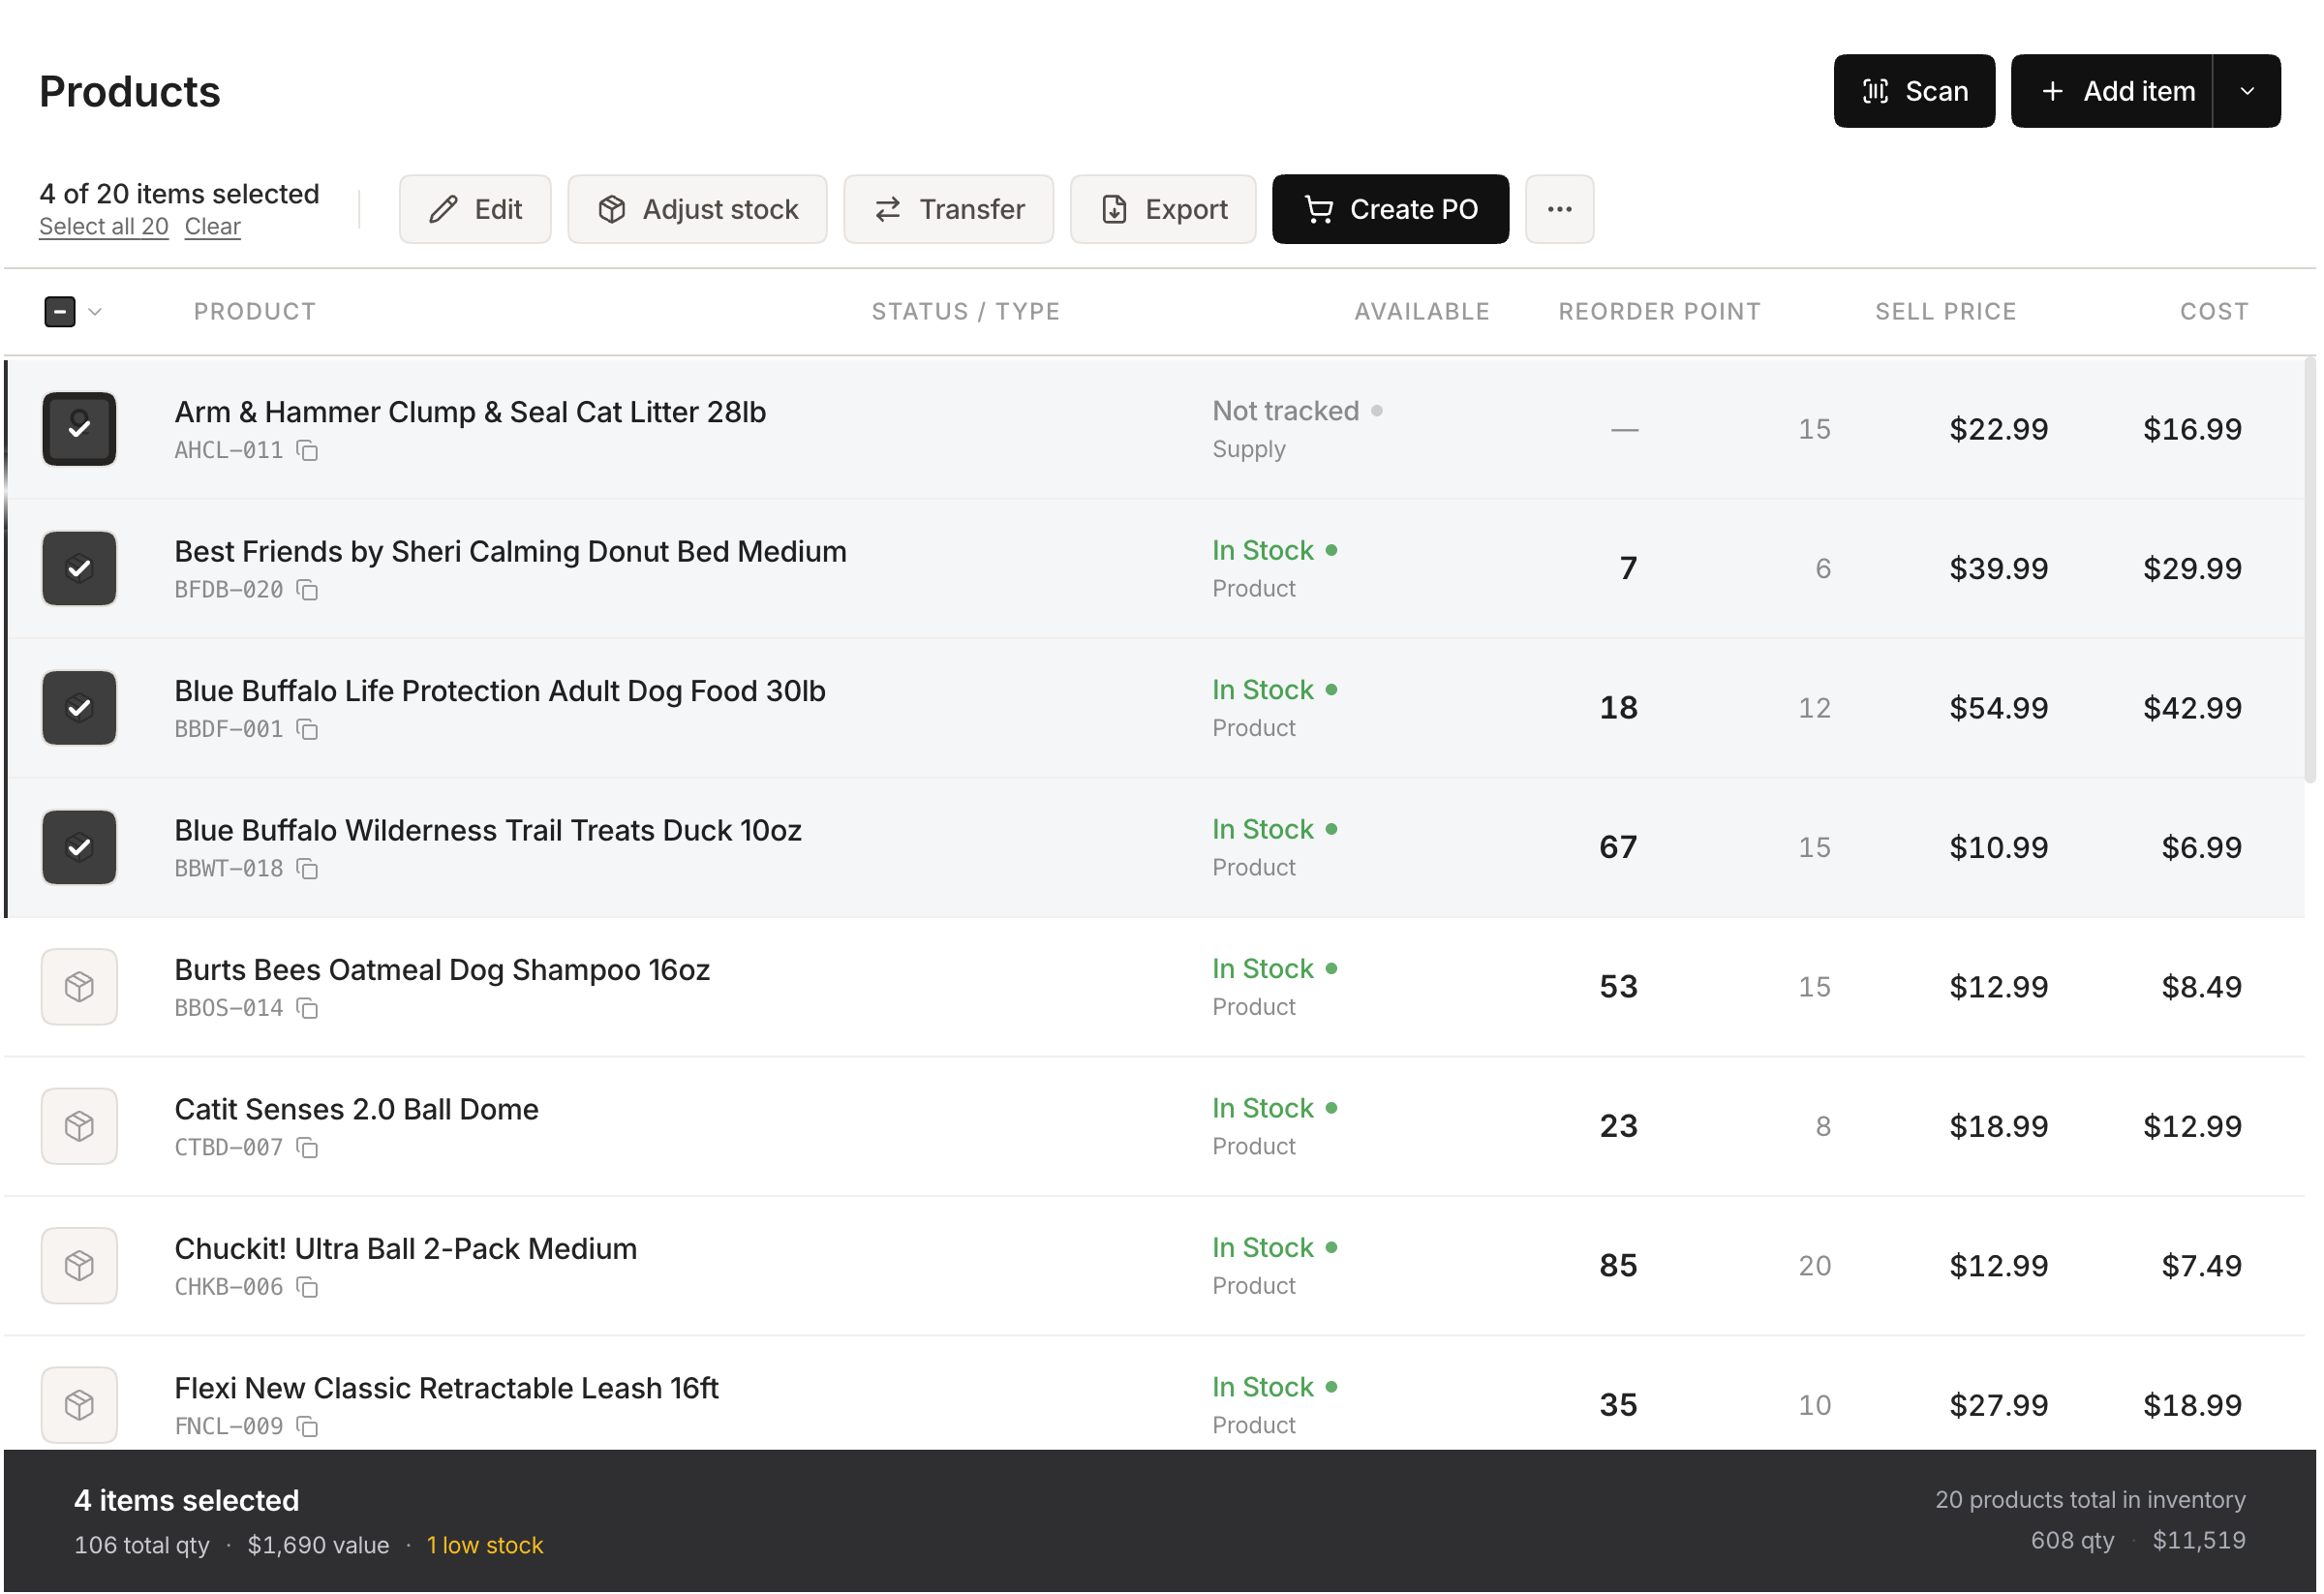 Stockria in action — Edit product details, adjust stock, and track cost from one screen.
There is no single "good" turnover ratio. It depends entirely on your industry and business model.
High turnover (8-12+): Common in grocery stores, fast food, and perishable goods. You sell quickly and restock often. The risk is running out of stock if a delivery is late.
Moderate turnover (4-8): Typical for general retail, clothing stores, and consumer goods. A healthy balance between availability and carrying costs.
Low turnover (1-3): Common for luxury goods, furniture, heavy equipment, and specialty items. These businesses carry expensive items that sell slowly. A turnover of 2 for a furniture store is normal. A turnover of 2 for a grocery store is a problem.
Industry benchmarks
These are rough annual benchmarks. Your actual target depends on your specific product mix and market.
| Industry | Typical Turnover |
|---|---|
| Grocery / Perishables | 12-20 |
| Fast fashion | 8-12 |
| General retail | 4-8 |
| Ecommerce (general) | 6-10 |
| Sporting goods | 3-5 |
| Furniture | 2-4 |
| Jewelry | 1-2 |
| Heavy equipment | 1-3 |
How to improve your turnover ratio
Clear slow movers. Run a report on items with no sales in 60-90 days. Discount them, bundle them, or discontinue them. Dead inventory drags your ratio down.
Order smaller quantities more frequently. Reduce your average inventory by ordering closer to when you need the stock. This requires shorter lead times or more reliable suppliers.
Improve demand forecasting. Better predictions mean buying the right quantities. You sell through faster because you are buying what customers actually want.
Raise prices on slow sellers. Sometimes low turnover is a margin issue, not a demand issue. If an item ties up shelf space for months, its margin should reflect the carrying cost.
Drop underperforming SKUs. More products does not always mean more revenue. A focused catalog with items that sell turns faster than a bloated one.
Monitor monthly, not yearly
Calculate turnover monthly or quarterly, not just annually. A yearly number hides seasonal swings and emerging trends. Monthly tracking lets you spot problems — like a product category slowing down — before excess stock accumulates.