When a spreadsheet is the right tool
Spreadsheets are a perfectly good inventory system when your business meets these criteria: fewer than 100 SKUs, a single storage location, one or two people managing stock, and no real-time sync requirements with sales channels.
A coffee roaster selling 15 varieties at weekend farmers markets, a jeweler with 40 pieces on Etsy, or a small repair shop tracking 60 parts — spreadsheets handle these situations well. The key is keeping the spreadsheet structured and disciplined.
The right column structure

Your inventory spreadsheet needs these columns at minimum:
| Column | What it tracks |
|---|---|
| SKU | Your unique product code |
| Product Name | Clear, specific name |
| Category | Group for filtering |
| Quantity on Hand | Current stock count |
| Reorder Point | Level that triggers a new order |
| Reorder Quantity | How many to order |
| Unit Cost | What you pay per unit |
| Selling Price | What the customer pays |
| Supplier | Who you order from |
| Last Updated | Date of last count or adjustment |
Add a Total Value column with a formula: Quantity on Hand x Unit Cost. Sum this column to see your total inventory value at a glance.
Add conditional formatting to the Quantity on Hand column: highlight cells in red when the value drops below the Reorder Point in the same row. This gives you a visual low-stock alert.
Building useful formulas
A few formulas make your spreadsheet more useful:
Total inventory value: =SUMPRODUCT(D2:D100, G2:G100) where D is quantity and G is unit cost.
Items below reorder point: =COUNTIF(D2:D100,"<"&E2:E100) to count how many items need reordering.
Gross margin per item: =(H2-G2)/H2 where H is selling price and G is unit cost. Format as a percentage.
Days since last updated: =TODAY()-J2 where J is the Last Updated column. Sort by this to find stale records that need recounting.
Keeping it accurate
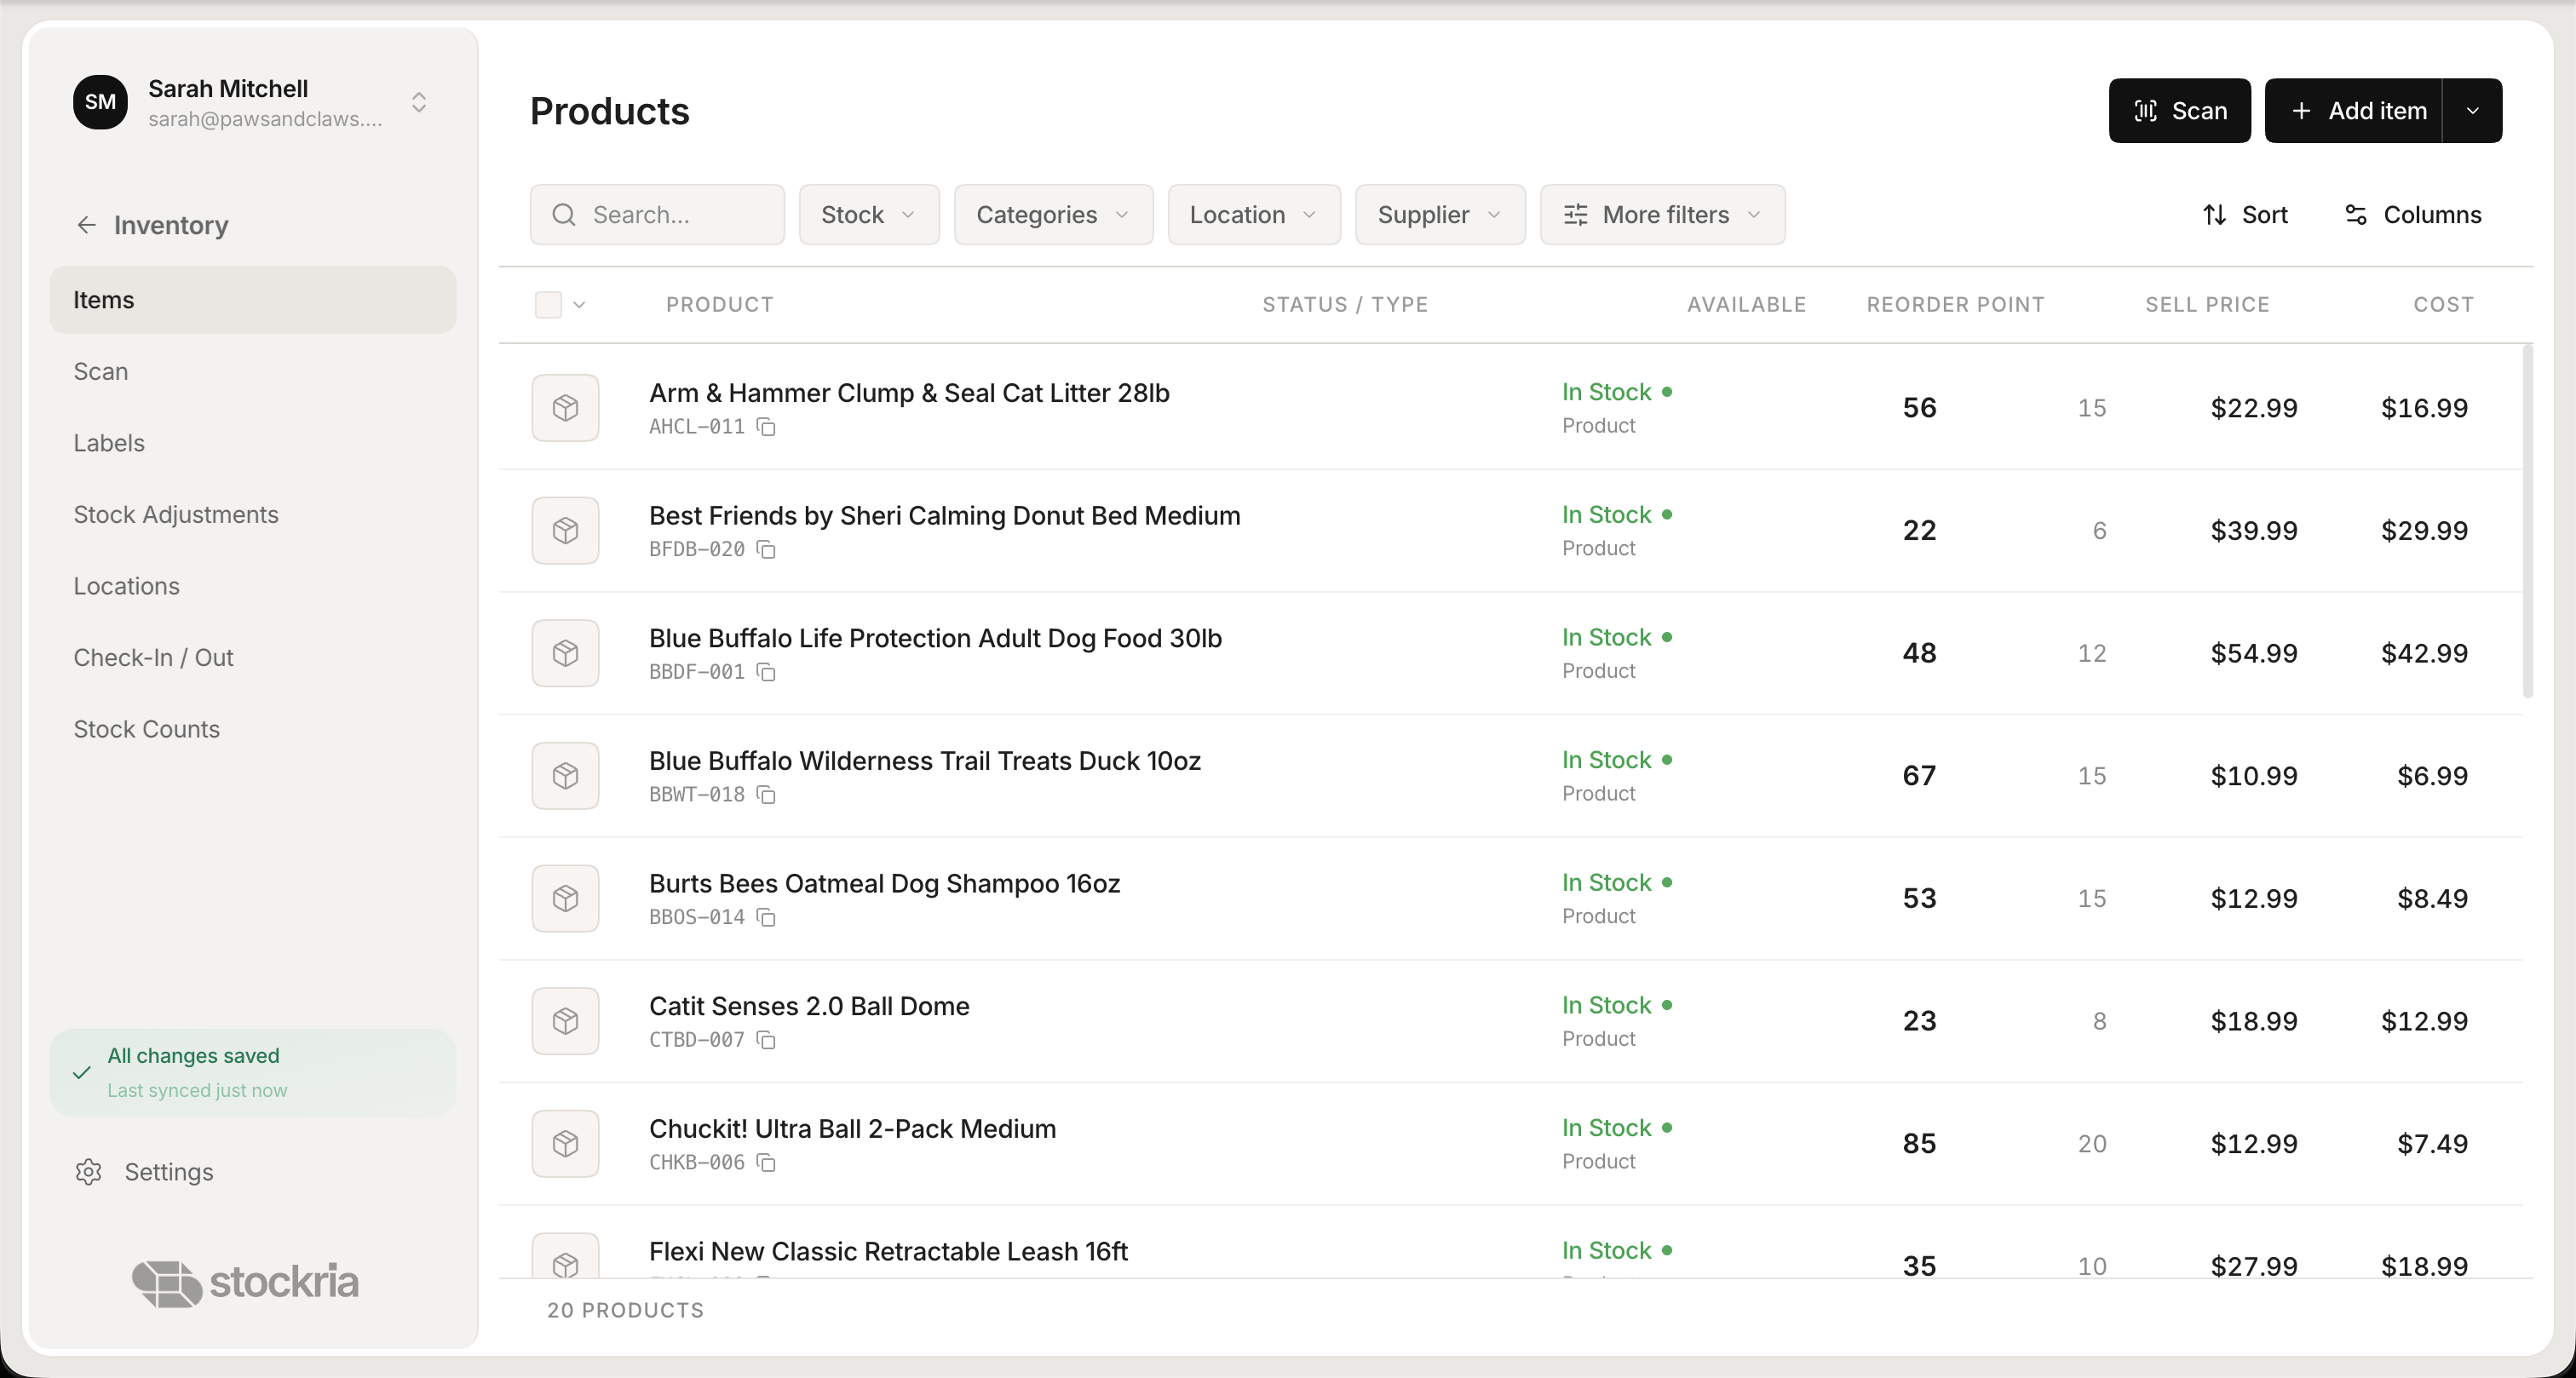 Stockria in action — Real-time stock levels across every location, updated with every scan.
The spreadsheet is only as good as the discipline behind it. Follow these rules:
Update immediately. When stock comes in or goes out, update the spreadsheet right away. Batching updates at the end of the day introduces errors.
Lock the structure. Do not add random columns or merge cells. Protect the header row so nobody accidentally overwrites formulas.
Count regularly. Pick 10-15 items each week and physically count them. Compare to the spreadsheet. Fix discrepancies immediately.
One version only. If the spreadsheet lives on someone's desktop, email a copy to someone else, and both get edited — you have a disaster. Use Google Sheets so everyone works from the same file.
The limitations of spreadsheets
Spreadsheets hit their limits in predictable ways:
No audit trail. Who changed the quantity of Item X from 50 to 30 yesterday? With a spreadsheet, you might never know. Google Sheets has version history, but it is not designed for this.
No real-time sync. You cannot connect a spreadsheet to your Shopify store and have quantities update automatically when orders come in.
No barcode scanning. You cannot scan items into a spreadsheet without additional hardware and complex setup.
Error-prone. One typo in a formula, one accidental row deletion, one copy-paste mistake — and your numbers are wrong in ways that are hard to detect.
Does not scale. Past 100 SKUs or with multiple people editing simultaneously, spreadsheets become fragile and slow.
When to graduate to software
The tipping point usually comes when you experience one of these: you oversell because the spreadsheet was not updated in time, you lose data due to a file error, you add a second sales channel, or you spend more than 30 minutes a day managing the spreadsheet.
Stockria imports directly from spreadsheets. Export your Google Sheet as CSV, upload it, and your products are in the system within minutes. You keep everything you built and gain real-time tracking, barcode scanning, and multi-user access on top.